Image credit: Tima Miroshnichenko, pexels

According to the 2020 consensus guidelines for therapeutic monitoring of vancomycin, it is recommended to target an area under the curve (AUC) of 400-600 mg*h/L to optimize vancomycin efficacy and minimize toxicity.1 The guidelines propose 2 methods for calculating vancomycin’s AUC: employing a first-order pharmacokinetic (PK) equation or using Bayesian software programs.
First-order PK equations utilize 2 postinfusion vancomycin levels to estimate patient-specific AUC.1 This method has been validated and employed for estimating vancomycin AUC at steady state (AUCss).2,3 The main advantages of this method include simplicity, accessibility, and minimal assumptions.1,4 However, because it provides static estimates, new levels are needed when patients’ hemodynamic status and renal function acutely change.1
Alternatively, Bayesian methods use mathematical modeling to integrate population PK with patient-specific estimates, including 1 or 2 vancomycin levels (depending on the PK model utilized) to calculate the AUC.5 This approach offers several benefits, including early AUC optimization with pre–steady state levels and decreased sampling burden.2,5 Despite the potential applications of the Bayesian approach, its adoption faces significant challenges due to the high cost and variability of PK models across different commercially available software.4-6
Although the clinical importance of AUC-based monitoring is well established, the majority of institutions in the US have yet to adopt this strategy. A 2020 survey conducted in the US revealed that 70% (142/202) of surveyed institutions had not adopted AUC-based monitoring; however, almost 60% (81/142) of respondents were planning on implementing AUC-based dosing within a year.7 When selecting an AUC calculation method, it is essential to recognize each approach’s differences and limitations. This article briefly overviews the methods available to compute vancomycin AUC in clinical practice.
First-Order PK Equations
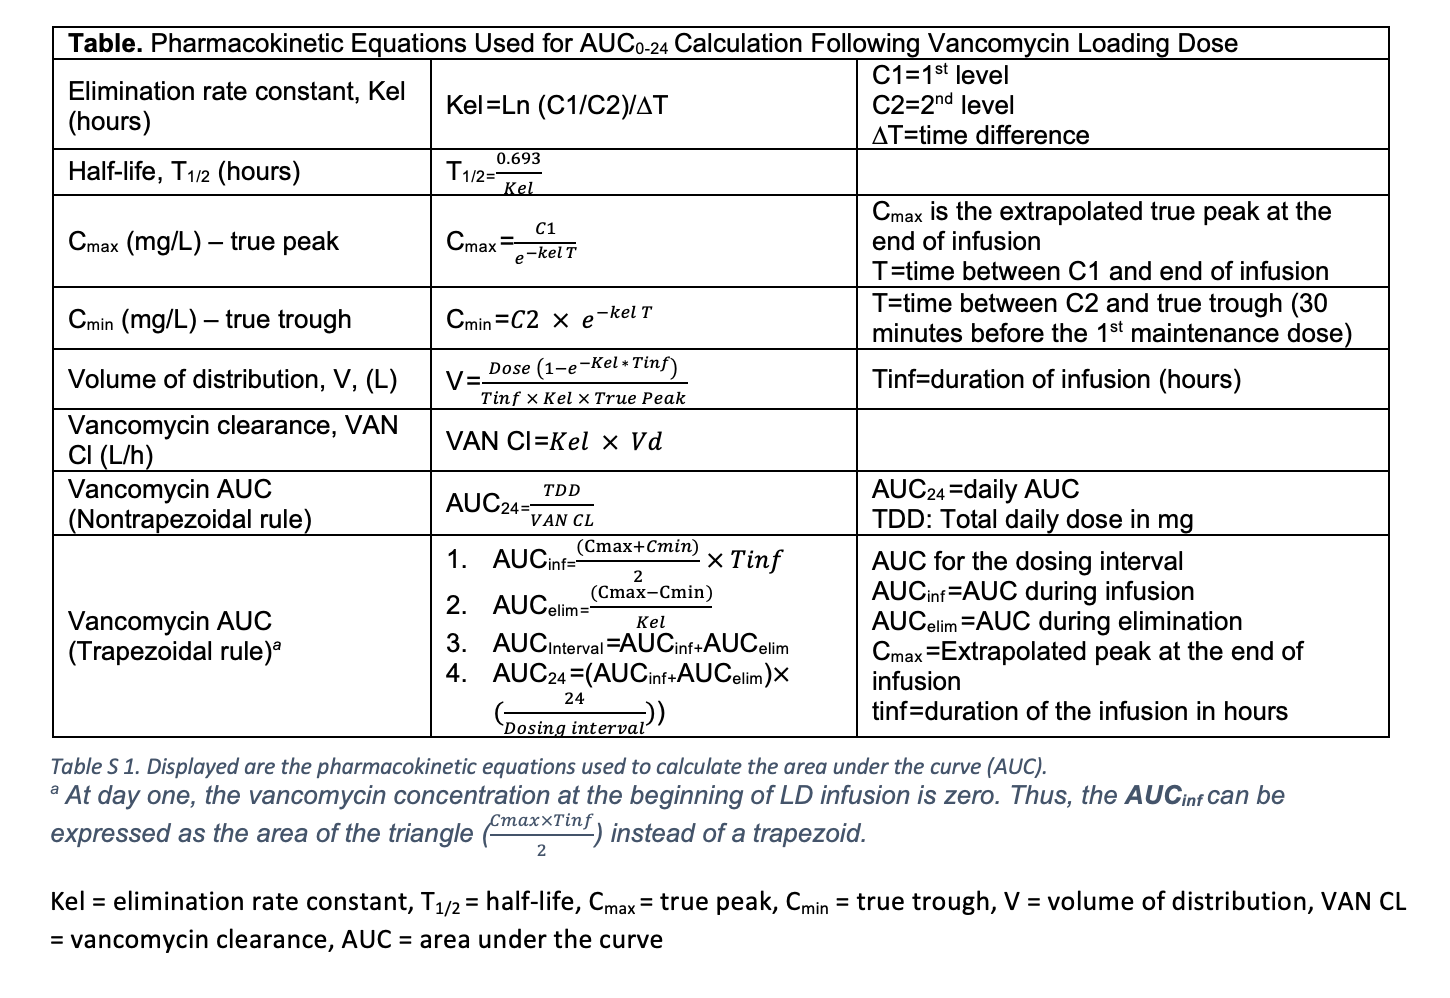
As described by the Sawchuk–Zaske method, first-order PK calculations use 2 postinfusion vancomycin levels, collected within the same dosing interval, to estimate the patient’s specific PK parameters such as elimination rate constant (Kel) and volume of distribution (V), peak plasma concentration (Cmax), and trough (Table).8,9 Two different methods can be used to perform the PK calculation: the trapezoidal and nontrapezoidal methods. Notably, both methods use different mathematical expressions to calculate the AUC, which could lead to differences in AUC estimates in specific clinical scenarios.

Trapezoidal Method
The trapezoidal method is the most used equation-based approach for clinicians to calculate the AUC.1,2,6 It has been validated by several groups, particularly for estimating vancomycin AUC at steady-state conditions.2,6
The trapezoidal method computes the AUC using the following equation:
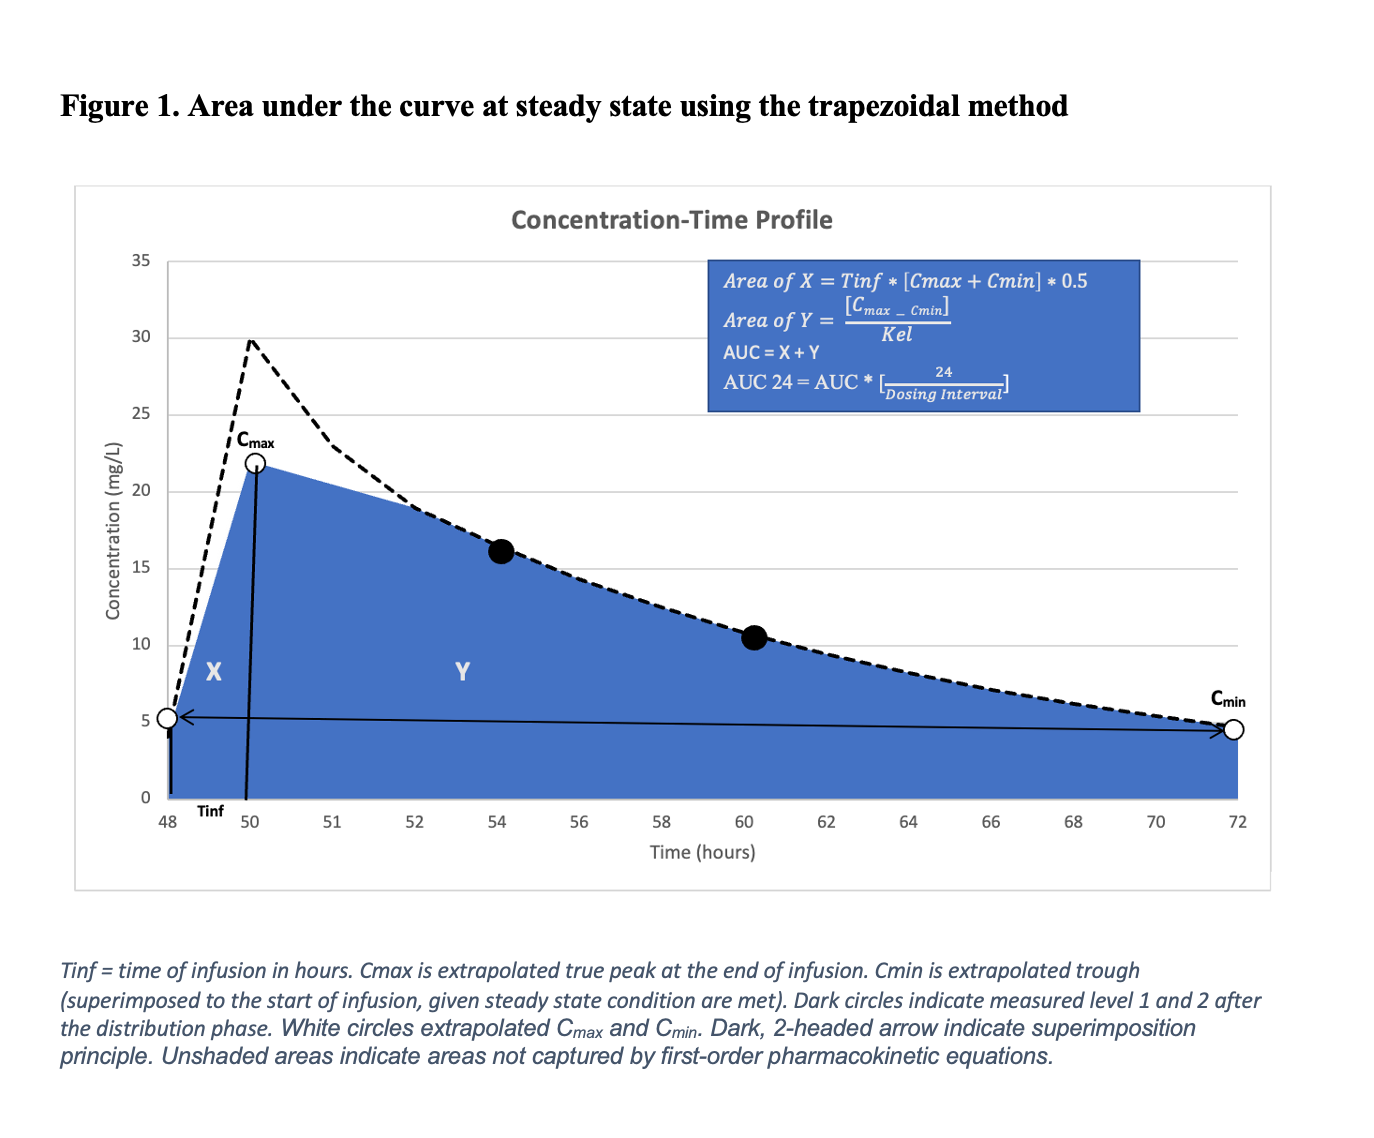
AUC24 = (AUCinf + AUCelim)(24/Tau), where AUC24 is the daily AUC. The AUCinf describes the area under the infusion curve and is expressed as Tinf* 0.5 * (Cmax + Cmin), while AUCelim describes the area under the elimination curve and is expressed as (Cmax-Cmin)/Kel, as depicted in Figure 1. In this context, Cmax and Cmin refer to the true peak and trough, respectively, and Tinf refers to the infusion time, typically in hours.2,6
At steady state, the AUCss is calculated by summing the area under the infusion curve (α-phase) represented as a trapezoid and the area under the elimination curve (ß-phase) modeled as a mono-exponential decay, also depicted in Figure 1. Detailed calculations are described by Pai et al.2 The resulting AUC must be adjusted for the number of doses administered per 24 hours to derive the AUC24.

For example, in a patient who received a vancomycin regimen of a 1500 mg loading dose (LD followed by 1000 mg every 12 hours, 2 vancomycin levels are collected near steady-state conditions (typically after the 4th or 5th dose) to estimate the Kel. This Kel value is then used to calculate the true peak (Cmax) and trough (Cmin) concentrations via back- and forward-extrapolation, respectively. The AUC under the infusion phase (AUCinf) and the elimination phase (AUCelim) are summed to estimate the AUC over a 12-hour interval. To determine the daily AUC (AUC24), this value is then multiplied by 2. Nonetheless, it’s important to note that steady-state conditions and a consistent vancomycin dosing schedule are required for accurate estimation of the final AUC24 value using this approach.2,10
The trapezoidal method can also be applied to estimate the vancomycin LD AUC within the first 24 hours of therapy.10,11 In this case, a modified approach is used, where the area of a triangle is substituted for the trapezoidal area under the infusion curve.10,11 In this case, the AUC₀-₂₄ is calculated by summing the area under the time-concentration curve following the LD administration. Hence, the resulting AUC0-24 reflects the exposure from the LD alone (eg, 1500 mg), without accounting for any maintenance doses given within the first 24 hours.11
Nontrapezoidal PK Equations
The nontrapezoidal method for estimating the AUC was first used in the landmark trial by Moise-Broder et al, which played a crucial role in establishing the AUC over minimum inhibitory concentration (MIC) target (AUC/MIC > 400) for patients with serious methicillin-resistant Staphylococcus aureus (MRSA) infections.12
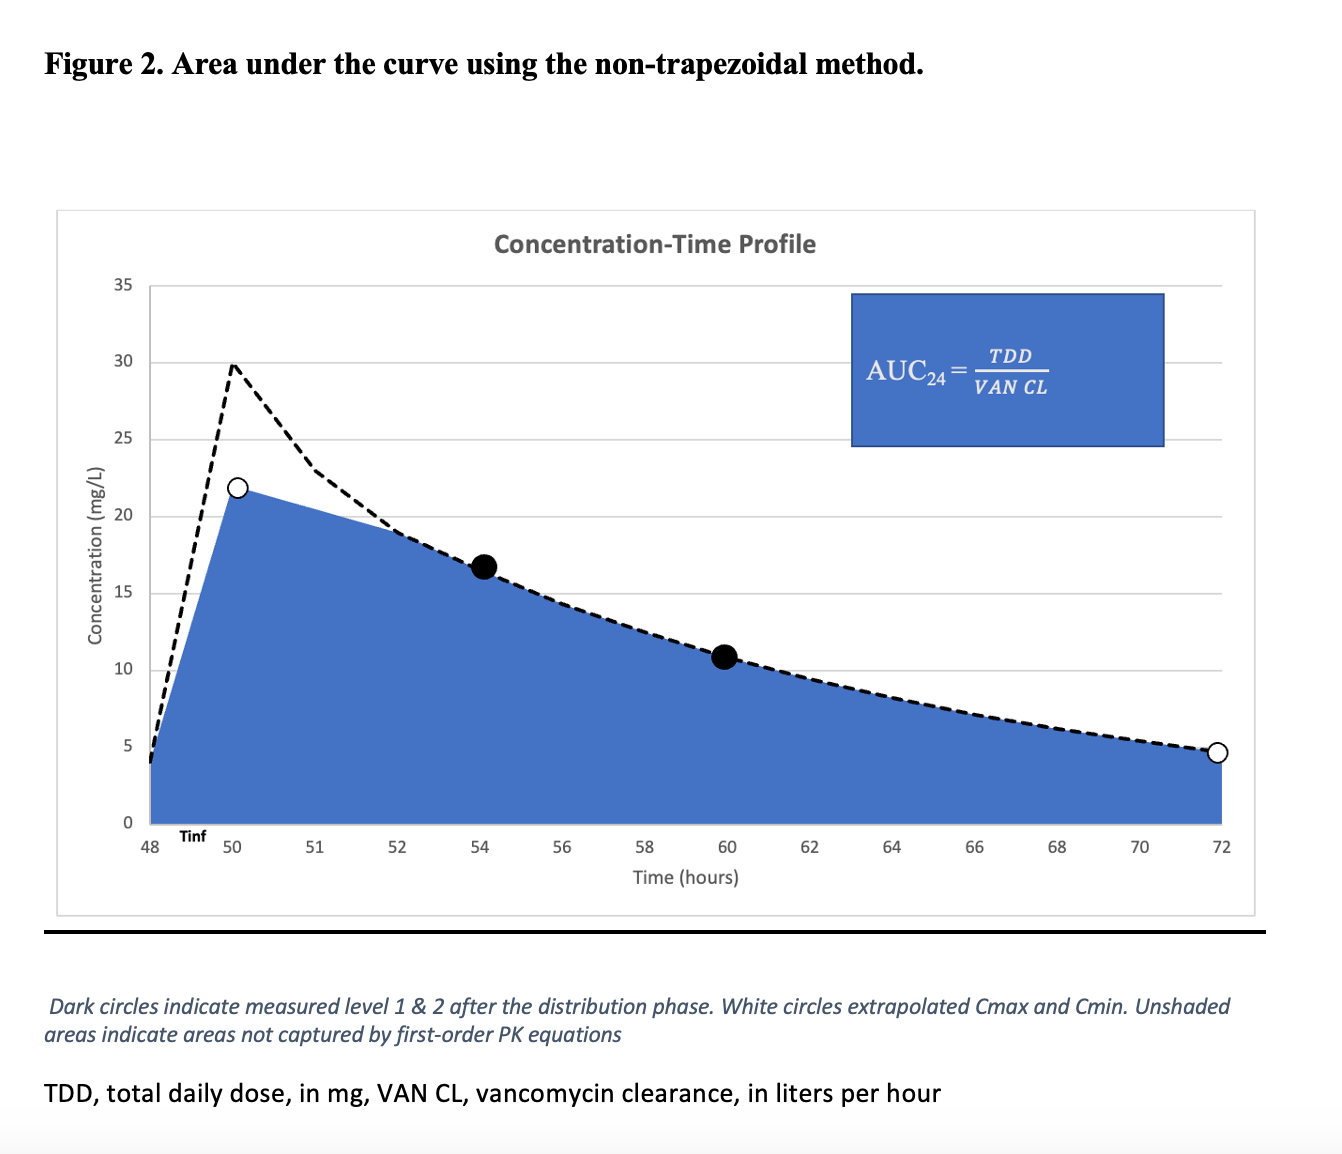
This method expresses the AUC as a function of vancomycin total daily dose and clearance, (AUC24 = total daily dose/clearance), as depicted in Figure 2.13 With the use of these equations, the disposition of vancomycin can be described using monoexponential decline (following the 1-compartment model); therefore, vancomycin clearance (CL) can be calculated using the compartmental approach (CL = Kel*V)14,15

Returning to the previous example, in a patient who received a vancomycin regimen consisting of a 1500 mg LD followed by a maintenance dose (MD) of 1000 mg every 12 hours, 2 consecutive vancomycin levels are collected to estimate the Kel, regardless of whether steady-state conditions have been achieved—with the use of the nontrapezoidal approach. The Kel is then used to compute vancomycin clearance using 1-compartment model equations, with the resulting 24-hour AUC (AUC24) being a function of vancomycin total daily dose and clearance.16
Unlike the trapezoidal method, the nontrapezoidal AUC estimation incorporates vancomycin total daily dose (LD ± MD) and can potentially be used to calculate the AUC within the first 24 hours of therapy (AUC0-24).16,17
Strengths and Limitations of First-Order Equations
Using timed postdistribution levels to calculate patient-specific PK parameters and AUC, first-order PK equations provide an accurate snapshot of vancomycin exposure with minimal assumptions.2 Several studies have compared AUC estimates calculated using PK equations to reference methods and found high accuracy and low bias.2,3,6,11 However, the AUC estimated by PK equations offers static estimates for a given dosing interval and does not account for dynamic physiological changes in the host.1 Flannery et al employed the nontrapezoidal method to estimate patient-specific PK parameters following a vancomycin LD.18 The day 1 parameters were generally similar to those at steady state; however, vancomycin clearance significantly differed, resulting in 59% target attainment at steady state. Therefore, it is recommended to collect 2 new levels to estimate AUCss or when there are changes in the patient’s hemodynamic status.
Additionally, first-order equations assume a 1-compartment model, which may lead to an underestimation of the true AUC for vancomycin, a drug best described by a 2-compartment model.2 Shingde et al, demonstrated that vancomycin AUC estimated via 1-compartment model equations underestimated the true AUC, as estimated by 2-compartment equations, by 8% (15 mg*h/L). Nonetheless, this difference is likely not clinically significant when applied to the target range of 400-600 mg*h/L.14
Finally, first-order PK equations can be seamlessly integrated using Excel sheet-based formulas in electronic medical records.18 This approach offers a practical and cost-effective solution for calculating AUC. For example, the Detroit Medical Center shared its real-world experience with using first-order PK equations for AUC-based vancomycin monitoring. In their postimplementation analysis, the authors reported that AUC-based monitoring was associated with a lower total daily dose of vancomycin and decreased rates of acute kidney injury (OR 0.52; 95% CI, 0.34-0.8).4
Bayesian Method
The Bayesian method applies the Bayesian statistical theorem, where model predictions are continuously updated based on new information. Bayesian software combines population PK data, such as patients’ vancomycin clearance and volume of distribution (Bayesian prior), with current patient-specific data, including measured drug levels (1 or 2 levels, depending on the PK model used), weight, and serum creatinine (Bayesian posterior). This iterative mathematical approach provides a refined estimate of AUC and dosing recommendations.19
The accuracy of Bayesian AUC estimates depends on the population PK model (Bayesian prior) and patient-specific covariates.5 Initial Bayesian estimates at therapy initiation rely on how well the current patient aligns with the Bayesian population model, leading to variability based on the patient and model used. However, as more patient-specific data are included in the model, the accuracy is expected to improve.5,20
Turner et al conducted a prospective observational PK study to compare the performance of commercially available Bayesian programs against the reference AUC-calculation method (log-linear trapezoidal rule using a rich sampling technique).6 The study reported an overall Bayesian accuracy of 80%, although accuracy and bias varied depending on the software used and the sampling strategy.
Strength and Limitations
Despite challenges such as cost and accessibility, current guidelines favor Bayesian methods over traditional PK equations. This preference largely stems from 2 key advantages: the reduction in sampling burden, as the Bayesian approach can provide reliable AUC estimates with trough-only sampling, and the early optimization of vancomycin exposure by utilizing pre–steady state levels to estimate AUC.1
It is important to note that trough-only sampling is recommended only when using Bayesian software that incorporates a population PK model based on richly sampled data.1,2
In a large population PK study by Neely et al, involving 48 adult patients with intensive vancomycin sampling, AUC estimates using peak and trough levels, as well as those using trough-only levels, significantly underpredicted AUC estimates generated by the complete data set by 14% and 22%, respectively.21 However, when the Bayesian prior was based on richly sampled data (the complete data set), trough-only sampling provided accurate AUC estimates with less than a 3% error rate. Conversely, when the Bayesian prior was based on peak and trough data, trough-only sampling yielded AUC estimates with a 15% error rate. Unfortunately, most published PK models are based on limited sampling.5,21-25 In a study evaluating the performance of various commercially available Bayesian software against a reference method that utilized trough-only values, the true AUC was underestimated in most of the tested programs. Therefore, until more data are available, it is more prudent to use both peak and trough levels for AUC estimation, especially in patients who are less represented in PK models—which includes those who are critically ill, have an unstable renal function, are obese, have hematological malignancies, or are pediatric patients.1
Finally, Bayesian methods potentially offer greater sampling and operational flexibility compared to first-order PK equations. In a quasi-experimental study, the Bayesian approach yielded more usable vancomycin concentrations for AUC calculations than first-order PK equations.26 Additionally, the vancomycin AUC assessments were completed faster when compared to the use of the first-order PK equations (4 minutes vs 7 minutes; P = .019).26 This is beneficial, as the early optimization of vancomycin AUC/MIC (within the first 24 hours of treatment) has been associated with positive clinical outcomes in patients with MRSA bacteremia.27
Conclusion and Practical Comments
In summary, the first-order PK equations and Bayesian methods are valuable tools for estimating vancomycin AUC. First-order PK equations offer a straightforward and cost-effective approach, providing high accuracy and minimal bias under steady-state conditions; however, they are limited by their assumption of a monoexponential decline and the requirement for steady-state conditions. While the nontrapezoidal method lends itself to potential utilization in estimating and optimizing AUC within the first 24 hours of therapy, further research is needed to validate these estimates against a reference method. In contrast, Bayesian methods offer greater flexibility and can provide reliable AUC estimates with fewer samples, even before reaching a steady state.
Ultimately, selecting the appropriate model for each patient is critical, as variability exists.
Considering each approach’s described strengths and benefits, each clinician must evaluate their patient population and resources to determine the most practical method to integrate.


